
There’s an unmentioned truth in marketing that no one ever really tells you about before you’re in.
It’s that a lot of the day-to-day tasks will revolve around spreadsheets, dashboards, and reports.
To be more precise – and this is especially true if you’re in a small business or agency – you’ll actually be spending a lot of your time building these reports.
Excel spreadsheets, PowerPoint presentations, you name it.
The problem?
In short: it’s time-consuming. Too much.
And if you’re reading this you’re probably aware of that, too.
Luckily for us, there’s a solution that makes it simple-ish to create beautiful dashboards in minutes that you can share with stakeholders, clients, or your team.
That solution is Google Data Studio.
In this post we’ll cover all the basic steps to get you started with one of our favorite tools.
Let’s get to it.
What is Google Data Studio?
Google Data Studio is a free reporting tool that makes it easy to connect and pull data from different data sources and create easy-to-understand reports and dashboards.
With its’ easy drag-and-drop interface, you can build reports in a matter of minutes without any technical knowledge.
There are a few reasons as to why you, as a marketer or business owner, should be using Google Data Studio.
Multi-Channel Reporting: Pull data from different sources such as Google Analytics, Google Sheets, Facebook Ads, and more.
Real-Time Reporting: Once you connect your sources, your reports will update whenever any change is made to the data source, or update automatically in real-time.
Interactive: Users can interact with the reports and update fields dynamically to better visualize data.
Easy to Use: Google Data Studio is a relatively easy tool to use – even though you do need some experience to get the most out of it.
The best of it all? It’s free!
Well, for the most of it.
In this post we’ll explain how you can easily create your own Google Data Studio report for your PPC campaigns in under 10 minutes.
How Does it Work?
Google Data Studio works by connecting your report to different data sources that allow you to present data in interactive dashboards.
Connecting to your data involves two different components that work together.
- Connectors: a connector is the bridge that links Google Data Studio to your platforms. Once a connection is done, Google then creates a data source in Data Studio.
- Data Sources: a data source is the result of that connection. For example, a connection to a Facebook Ads account. Data sources let you access the dimensions and metrics from that account, made accessible by the connector.
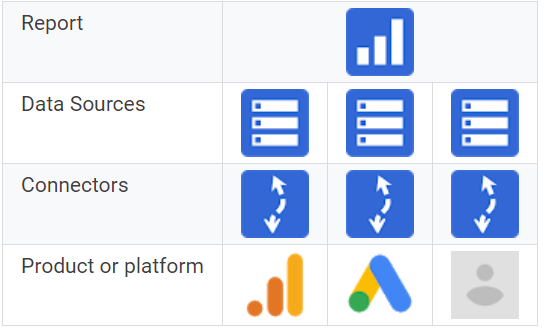
In other words, connectors allow Google to access data from different products and platforms and translate them into data sources that Data Studio can pull into the dashboard.
Now that we know how Data Studio works, let’s get to it and build our very own Google Data Studio report.
Creating Your Report
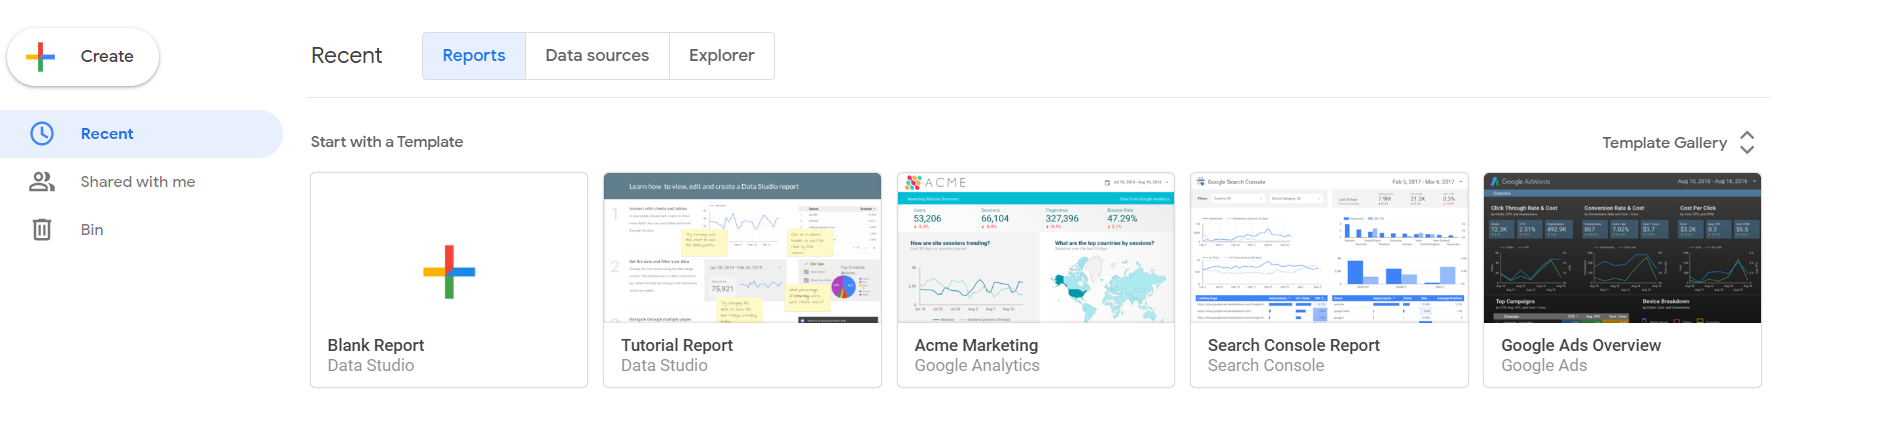
Once you access Google Data Studio, you can choose between creating a new report or starting with one of Google’s templates.
If you haven’t used Google Data Studio before, we recommend picking a template so you can learn how to use it before you create your own dashboards.
Once you select the template you wish, hit ‘Use Template’ and click on ‘Copy Report’.
You now have access to the foundation of your Google Data Studio dashboard.
The next step is to pull in the data from the platforms you wish to report on.
With Google Data Studio, you can build automatic reports that pull data from a lot of different platforms/channels – even if they’re not Google’s property.
Yes, you can even connect your Facebook or LinkedIn Ads account.
To do so, you will need to create a data source and connect it to Data Studio.
Creating Your Data Sources
The first step in any Data Studio report is to create a data source – and this is where it might become… well, not free.
As Google Data Studio is a Google property, if you wish to connect to a Google Ads account, you won’t have any additional costs.
However, if you’re connecting Data Studio to a Facebook Ads account, you’ll need a different type of connector.
There are three different types of connectors.
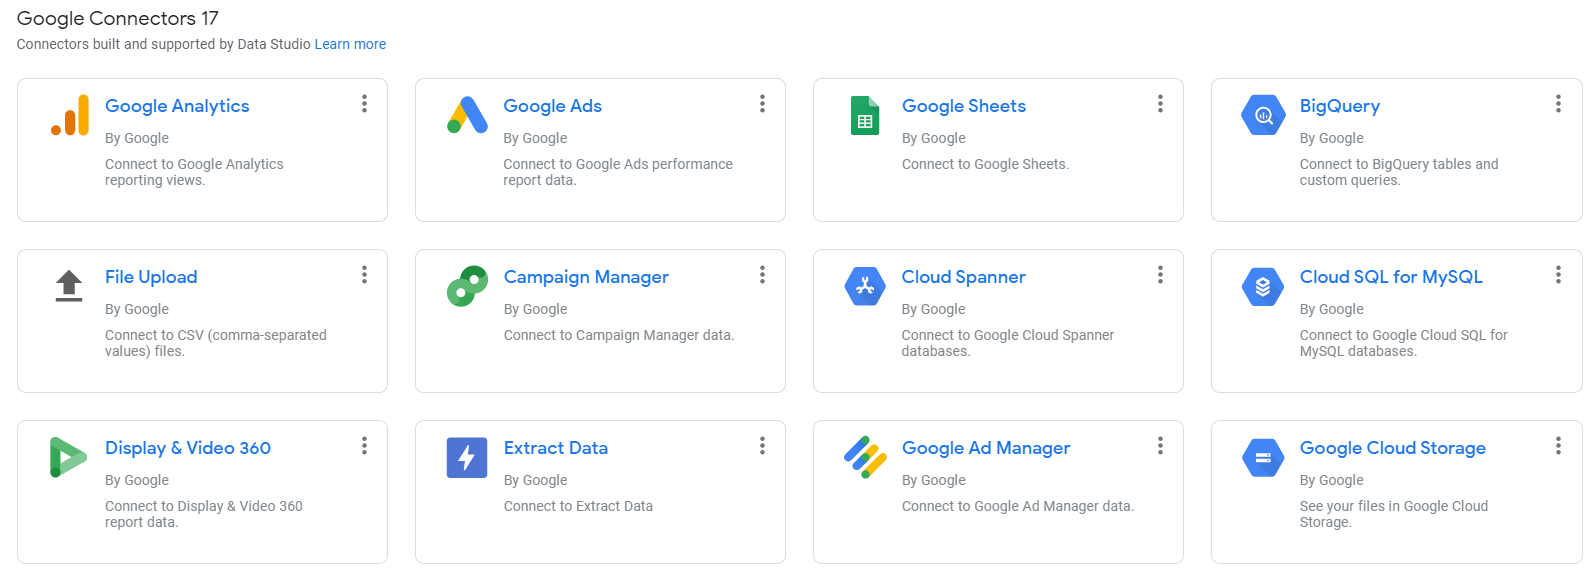
- Google Connectors: these are built by Google and let you access data from Google Analytics, Google Ads, Google Sheets… basically, everything owned by Google. These connectors are all free.
- Partner Connectors: these are built by Data Studio developer partners and let you access data stored in non-Google platforms such as Facebook, Twitter, Reddit, and so on. Some/most of these are paid.
- Community Connectors: these are built by the general public – you can even build your own. We won’t cover these in detail in this post.
Here’s our recommended free Facebook Ads connector.
To create a data source, you will need to use one of these connectors and link Data Studio to an account.
Here’s how you can do that.
Once you’re in the dashboard section, click the “Resources” menu and then hit “Manage added data sources”.

Then, click on “Add a Data Source”.

Finally, choose the connector you want and follow the provided on-screen instructions.
It shouldn’t take more than a few minutes.
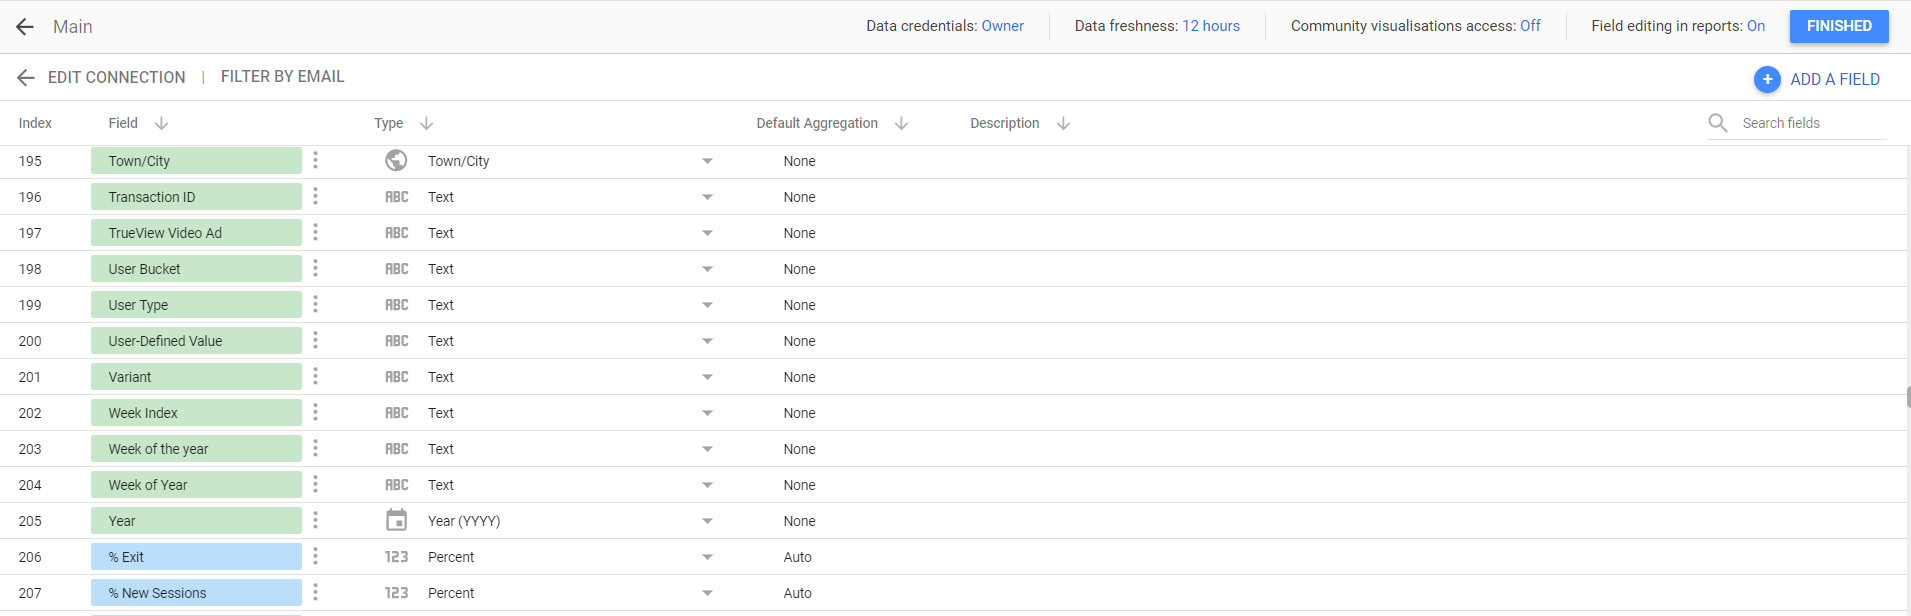
As you’re about to finish the process, you should be able to see the available dimensions and metrics in your data source.
We’ll discuss dimensions and metrics in a minute.
Go ahead and click “finished”.
Partner Connectors
Before we proceed any further in this post, you might be wondering “what if I want to connect my dashboard to a Facebook Ads account instead?”.
In the example above, we used a Google Connector to create a data source from Google Analytics.
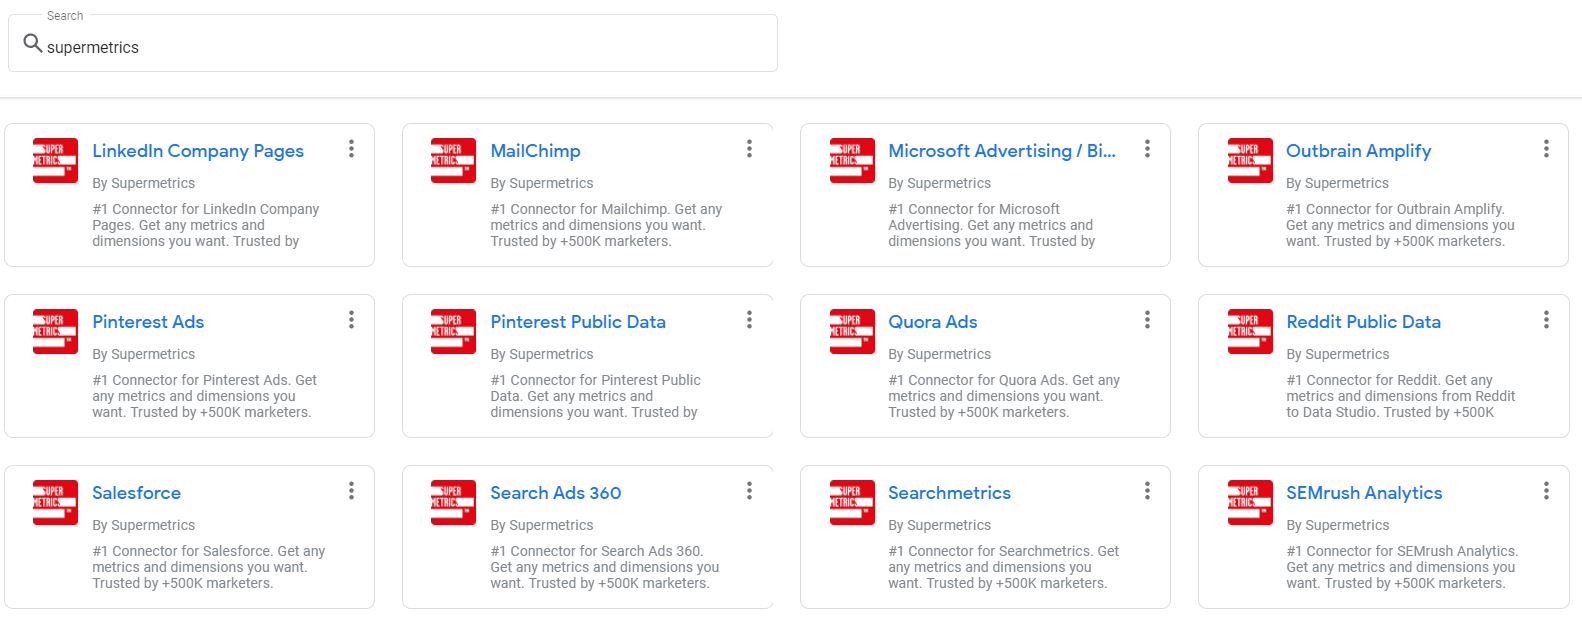
However, if you wanted to connect your dashboard to a Facebook Ads account, you would have to use a partner connector. We recommend SuperMetrics since it’s the most advanced connector out there, and has integrations with nearly every platform you need.
Click here to get a 14-day free SuperMetrics trial.
SuperMetrics is a paid connector that allows you to create data sources from most available advertising platforms.
To use this connector, you only need to scroll down to the “Partner Connectors” section, search for SuperMetrics, and install the connector for your desired platform, as you did with the Google Analytics connector.
You’ll have access to a 14-day trial but, after that, you’ll be required to pay a monthly fee to keep on using it.
Navigating Google Data Studio
Google Data Studio makes it very easy to build interactive dashboards that report on business results in real-time.
Once you’ve created your data source, you can choose from a lot of different options to structure and present your data.
- Create interactive maps to report on individual countries or regions
- Build charts to visualize growth over a period of time
- Report on individual metrics with scorecards
- Include text sections to include notes and provide more detail to clients or team members on the data.
Creating Charts, Tables, Maps & More
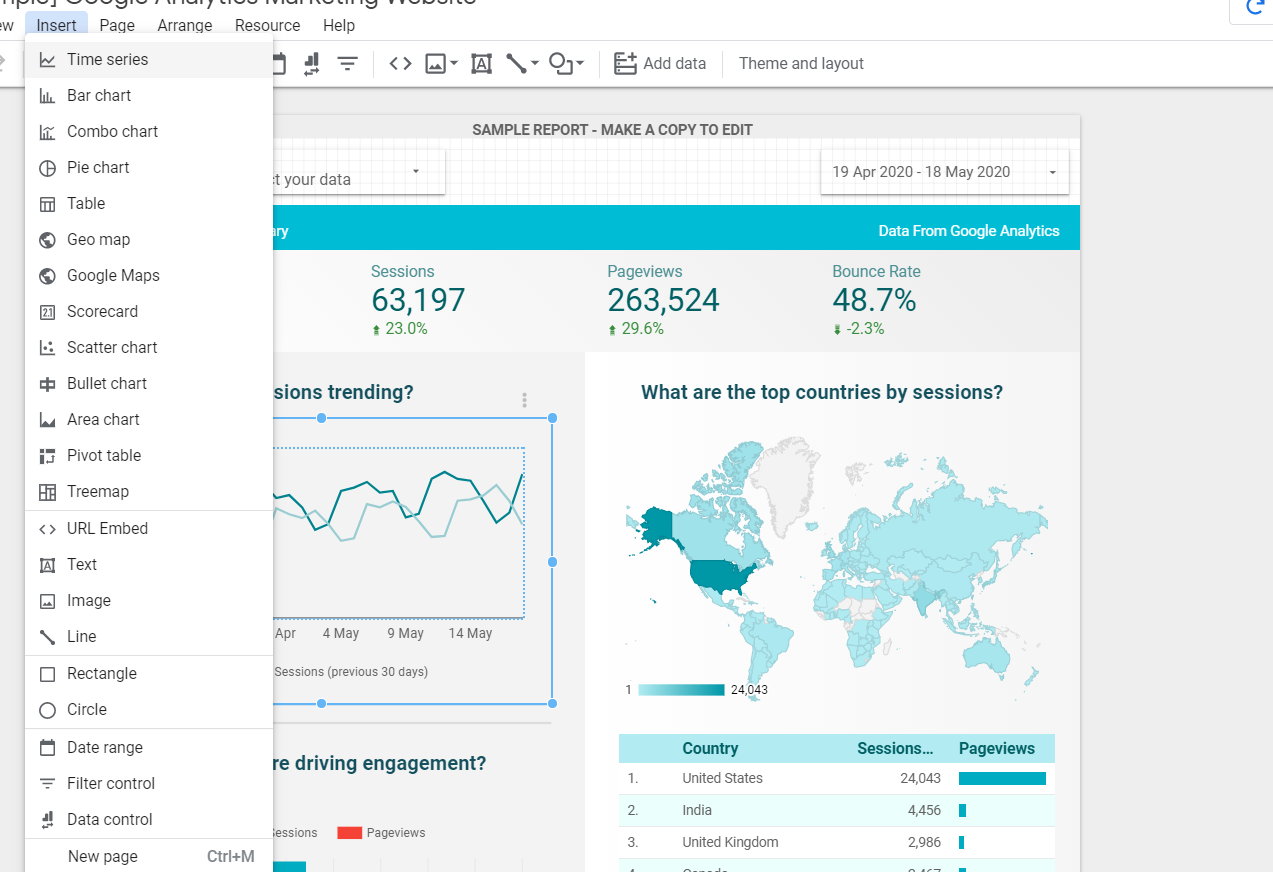
To create a chart – or any other visualization element –, navigate to the top menu and click ‘Insert’.
Once the drop-down menu shows, you can select from a wide assortment of charts, tables, maps, and a lot more.
Select the chart type you want and choose where you want it to appear.
To edit the data in the chart, click the chart and the console will show in the right side of the screen.
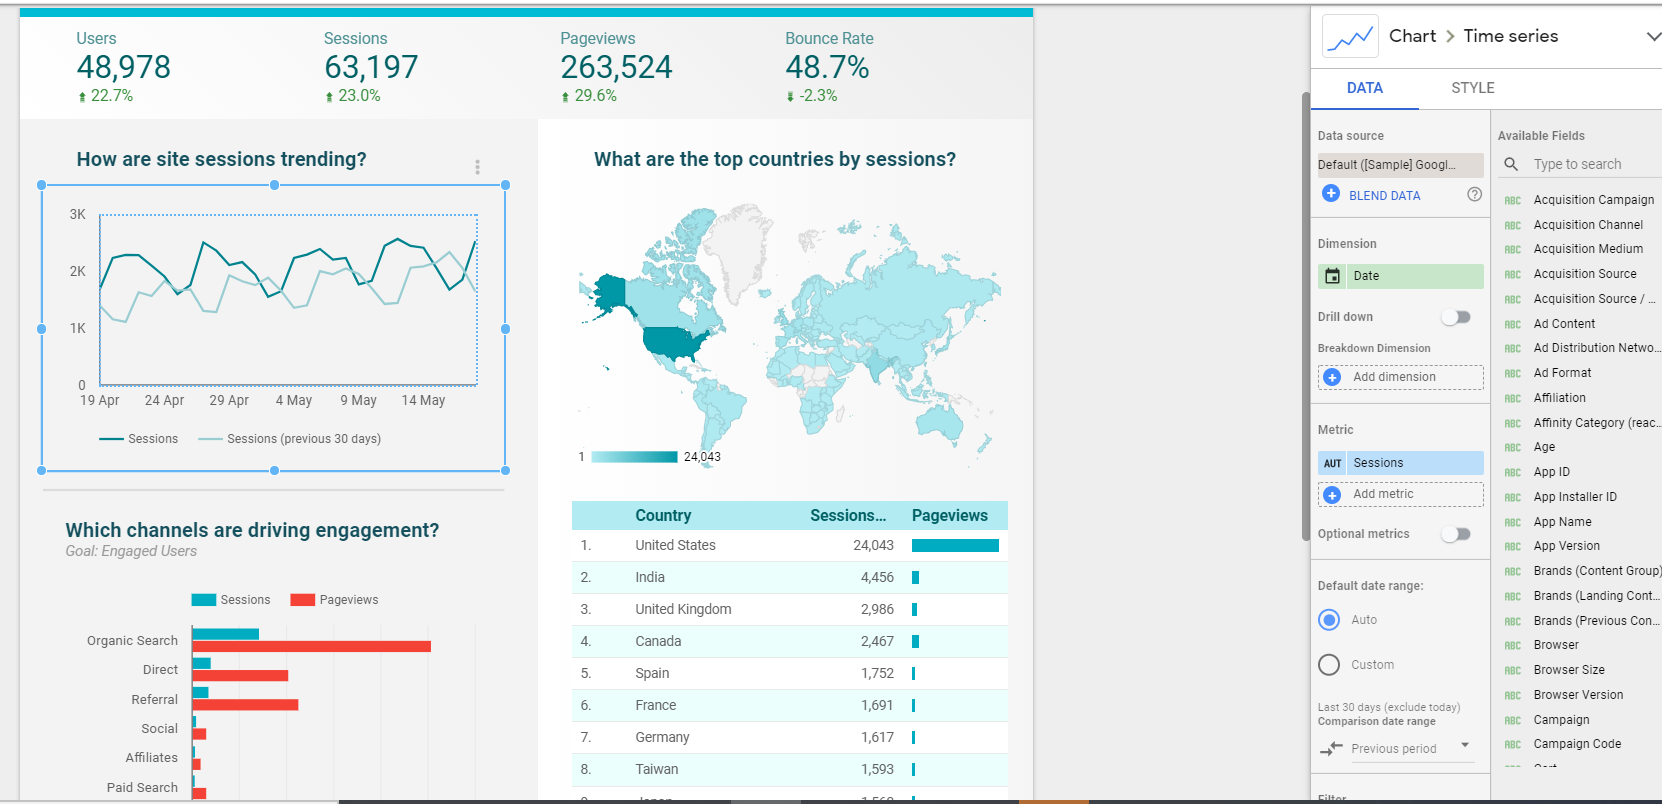
As you’ve guessed by now, in the data source field on the top, you’ll select the data source added at the start of this post.
Now, all that’s left is to select the data you wish to display.
Dimensions & Metrics in Your Data Source
Before you can display the data you want in a report, you will need to understand how dimensions and metrics work.
According to Google, dimensions “describe or categorize your data.”
For instance, a country, campaign name, or a date, are all considered dimensions.
On the other hand, metrics measure your dimensions. If you wanted to show how many sessions were recorded in the United States, you would define “Countries” as your dimensions, and “Sessions” as your metric.
Easy, right?
You can add more than one metric per dimension, depending on the chart you selected.

Customizing Dimensions & Metrics
One of Google Data Studio’s greatest features is the ability to manipulate and customize the data you pull from different data sources.
As marketers, this is especially useful when we need to report on metrics such as conversion rates, customer acquisition costs, or the average order value.
This is very easy to do.
- Click on ‘Add Metric’.
- Click on ‘New Field’.
- Type in your metric’s formula.
- Hit ‘Apply.

Filters & Date Range Controls
As you’ve seen so far, Google Data Studio makes it possible to create incredibly detailed dashboards.
However, besides all that, Google Data Studio also enables viewers to control the data and select specific subsets of data.
For example, you could add a filter control that enables users to view the data only for a specific country.
To create a filter, click on ‘Insert’ again in the top menu, then on ‘Filter Control’, in the bottom. Then, select the dimension you want to add as a filter.

This enables viewers to look at the report in a much more granular way.
We won’t dive too deep into filters, as there’s enough to discuss on the matter that it will likely deserve a dedicated post.
Sharing Your Report
You’re about finished with the report!
You can always, of course, add more tables, charts, and other elements to it in order to make it more detailed and complete.
That is up to you.
Once you’re finished with the report, you’ll have to share the report with… well, whoever you want to share it with!
To do so, you can simply click on the ‘Share’ button on the top right, and choose your preferred method.

We usually share the report link, but any other option works.
Closing Thoughts
Google Data Studio is one of our favourite tools in our toolset, as it should be for most marketers out there.
There are, of course, plenty of dashboard and reporting tools – some intended for more advanced needs, some with added benefits for agencies, and some for small businesses.
However, due to its ease of use, low costs, and intuitive features, our preference goes out to Google Data Studio for most of our needs.
In this post we discussed some of the basics for Google Data Studio.
However, there are some – plenty, actually – more advanced features out there that will enable you to unlock its full potential and build stunning dashboards that will amaze your clients, boss, or whoever sees them.
Did you have any issues with your dashboard?
Let us know in the comments below and let’s talk!

