As media buyers, we spend a lot of our time around spreadsheets, dashboards, and tables.
Whether we’re building these reports for ourselves, our bosses, or for our clients, they play an important role in making sure targets are being met, and keeping everyone in the loop.
advertisement
One of the easiest ways to do so is through Google Data Studio.
However, if you’re familiar with the platform, you’re aware that to pull data from non-Google-owned properties, you need to resort to external tools.
The problem?
Well, more often than not, these tools have a monthly cost.
Even though most of these tools – or connectors – come at an accessible price, you might not be able to afford the costs at this point.
So how can we take advantage of Google Data Studio without the additional costs?
Introducing Adveronix
Adveronix is a free Google Sheets add-on that enables you to easily import data from a wide range of different channels and automate reports with Google Data Studio.
This free connector works by pulling data into a Google Spreadsheet so you can then link it to your Data Studio dashboard.
You can even schedule the data to be imported automatically on a daily basis, or whenever you want.
Oh, and did we mention it’s FREE?
Installing Adveronix
Before we get started with Google Data Studio, we will need to create our Data Source first.
If you’re not used to Google Data Studio connectors and data sources, we recommend you read our post on how to use Google Data Studio before proceeding any further.
To create our data source, we will have to install the Adveronix Google Sheets add-on.
You can do this by opening up a new Google Spreadsheet and hitting the ‘Add-ons’ button on the top menu, and click “Get add-ons”.
Then, search for “Adveronix” and install the add-on.
It’s that simple.
Create Your Custom Report
Once the add-on is installed, you will then need to customize your report and select the channels you wish to import into your spreadsheet.
Open the “Add-ons” menu on the top menu again and you should now see the Adveronix add-on.
Click “Launch”.
You should now see the control panel open up in the right side of your screen, where you can choose the channels you want to import the data from.
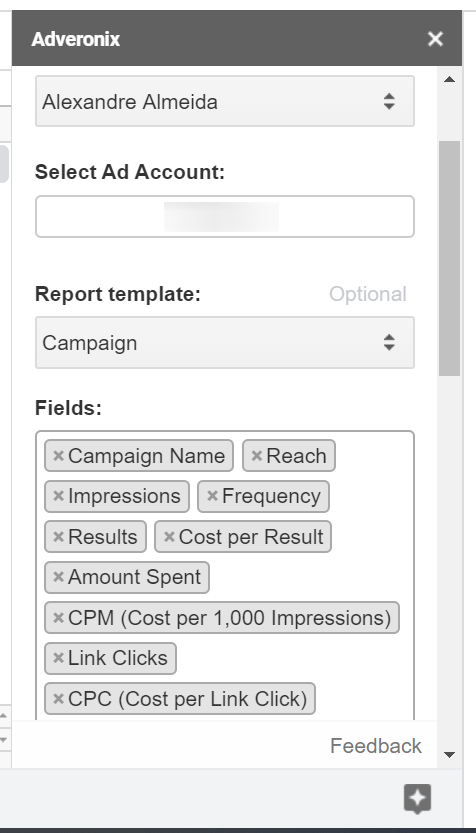
Since our goal is to create a Facebook Ads report, we’ll choose “Facebook Ads” – well, duh.
Now you only have to select the ad account, the fields, and the breakdown (if any) you want to import.
You can even use some of Adveronix’s own report templates to make the process even easier.
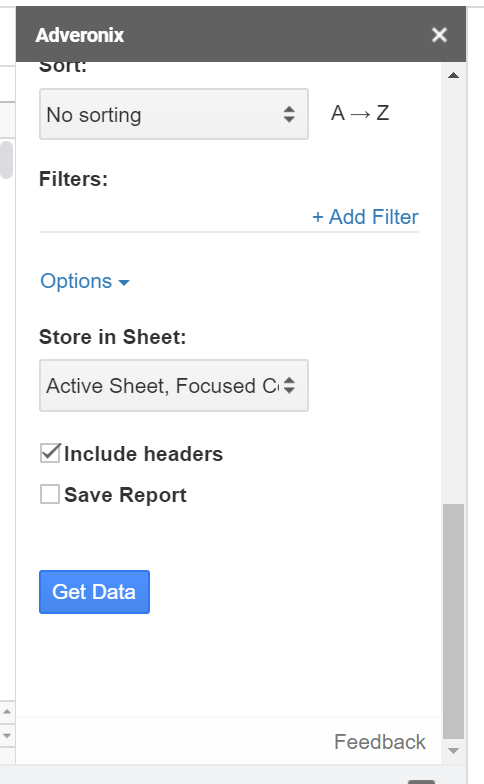
When you’re done with your selection, you will then want to scroll down to the bottom of the control panel and hit the “options” button. This should show the option to save the report, as displayed in the image below.
Hit “Save Report” and name it however you see fit. Then, click “Get Data”.
Do not skip this step.
That’s it!
Schedule the Reports
There’s one last step we need to take before we can head to Google Data Studio and actually build the report – scheduling the report to run automatically.
In the previous step, you save the report before running it.
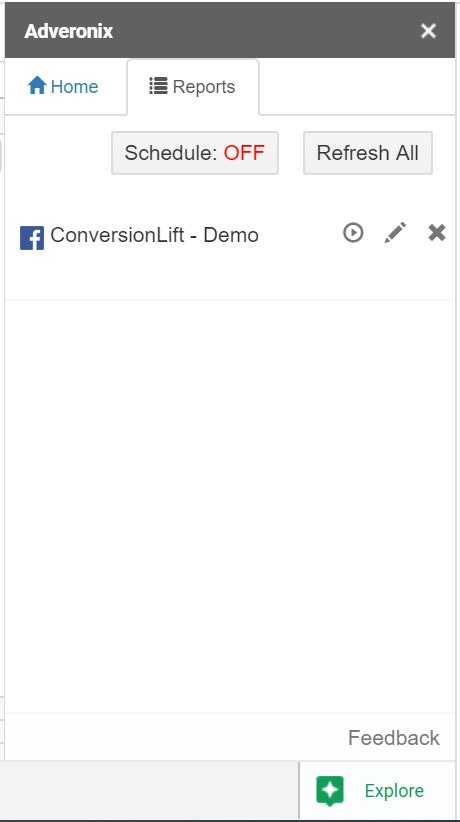
If you scroll to the top of the panel, you should see the “Reports” tab and, in it, the option to schedule the report.
Hit the “Schedule: OFF” button and select how frequently you want to run the report. We recommend running it daily, at least.
Now, with all that out of the way, it is now time we open up Google Data Studio.
Create a Data Studio Report & Choose Your Data Source
Now that we have already created the data source for our Google Data Studio report, we will only need to connect it to our dashboard.
Open up your dashboard and click the “File” button in the top menu, then “Report Settings”.
In the report settings panel to the right, click on “Data Source” and select the spreadsheet you just created with Adveronix.
Note: if you want to include multiple channels (like Twitter or Bing) in the same Data Studio dashboard, create a worksheet for each channel using Adveronix and import them by repeating the process above.
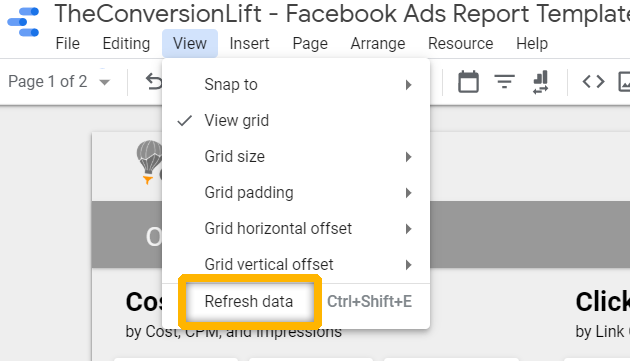
Once they are linked, just make sure each element in the report is properly linked to this data source and hit the “refresh data” button on the top “View” menu.
And you’re all done!
Limitations
As with most “free” things, they usually come with a cost.
While there are certainly no financial costs to using this tool, there are some limitations to it that other connectors don’t have – such as SuperMetrics.
It Requires Maintenance
If you’re used to using Google Spreadsheets as data sources for Google Data Studio, you know how troublesome these can be – sometimes.
Maybe it’s a date that’s in the wrong format or a value that’s identified as text and not as a number.
There are countless “pet peeves” that come with these spreadsheets, and while Adveronix does a great job at importing the data, it can’t fix some of these issues.
The bottom line is – it might require some “fixes” from time to time.
advertisement
It’s Not Real-Time
Unline SuperMetrics, Adveronix doesn’t pull data in real-time.
Even though you can schedule reports to run every hour, there are some situations where clients might demand real-time reporting – or your team might just be too picky about having the reports “only” update every hour.
Hey, we’re not judging!
Too Many Spreadsheets!
As you can guess, if you’re working with multiple clients and each requires multiple data sources created, it can get messy very quickly as you’ll need a whole boatload of spreadsheets.
However, nothing some Google Drive folders can’t fix.
Closing Thoughts
If you’re a freelancer or a new business owner who’s looking to cut down on costs, then Adveronix is a great way to get started with Google Data Studio.
With integrations with most of the “major” platforms out there, it will enable you to build powerful dashboards with Data Studio with minimal setup times.
However, as we mentioned above, it does come with its downsides – as most free platforms do.
If you’re looking to a more robust solution – if you’re working in agency, for example, and handle a lot of clients – then Adveronix might not be the right fit for you.
In that case, we’ll recommend SuperMetrics (affiliate link) – even though it comes with a monthly cost.
In any case, if you’re just getting started with Google Data Studio, then you should absolutely go ahead and give Adveronix a try.
Did you have any trouble setting up Adveronix or your Google Data Studio report?
Let us know in the comments and let’s talk!


22 comments
hello, if I can ask a tip on how to elegantly push the value of 0, when for a given period Adveronix does not find any value (eg. 0 conversions in 7 days) and leaves the field blank.
Hi,
I don’t think Adveronix has that feature at the moment. If I may ask, why do you need the value to be zero? As a last resort, you could always opt for a Google Spreadsheet script that automatically turns all blank values into zeros – should be relatively easy to find a script for that.
Or simply use a simple formula that turns blanks into zeros – although that would require manual updates every now and then.
Let me know if I can help!
Cheers
Where can I find the Conversion Lift template Data Studio to use?
Thanks
Hi Nélio,
Unfortunately, our templates gallery page is down at the moment, but I can send it over via e-mail. Would that be OK?
Thanks
Alex
Please, send by mail. It will be great!
Thanks a lot.
Do you have my email? neliocastro (at) gmail
Hi Nélio,
Sorry for the delay – I’ve sent the report via email. Hope you find it useful!
Very good, thank you
Thanks for providing this tool – it is much appreciated. I have 3 questions. 1. Even though i named the report under the ‘options’ section the spreadsheet’s title in Sheets remains ‘untitled spreadsheet’ unless i manually name it. Am i doing something wrong? 2. If I want to show metrics over time in Data Studio, how do a configure the spreadsheet to enable this to happen? 3. Id like to use your template that another commenter mentions, where can i find it? Many thanks
Hi David,
Thanks for your comment! Answers to your questions below.
1. The spreadsheet and the Adveronix report can have two different names. Basically, you’re giving your Adveronix report a name so you can later access it under the “Reports” tab, or even build different reports for other channels, and set automatic schedules for these reports to update.
2. If you want to show metrics over time in data studio, under the “Breakdown” dropdown (right under the “Fields” dropdown), you will include the “Day” dimension. Then, on Google Data Studio, you can use this dimension in your charts and tables.
3. I’ve sent the template over to your email.
Let me know if I can help any further.
Thanks
Alex
Excellent blog post sharing valuable skills! Please help me with a link to Google Data Studio Report to use as a base as well.
Hi,
Thanks for your feedback!
I’ll send over the template via email – we will soon have our free resources page up, which will include a few additional templates (we’re working a mobile version for this template, too).
Thanks!
Hello, thanks a lot for these tips! I have got your Data Studio template: but I either got lost in the instructions or do I need to ask you also for Google/Adveronix spreadsheet template? (No way I’d be able to create these 72 or 22 spreadsheets myself! 🙂 Or am I missing anything…?
If I try to reconnect your tabs in the Data Studio process, it does not change anything in the template.
Thanks for your time and advice.
Hi Katerina,
Thanks for your comment!
You don’t actually need to reconnect to our data sources – you should use your own data sources so that Google Data Studio can pull the data from your account.
To do so, you need to create a new Google Spreadsheet and use the Adveronix add-on to pull the data from your account into this spreadsheet.
Then, simply choose which dimensions and metrics you want to download, set a schedule so the data refreshes on a daily basis, and connect this spreadsheet to your Google Data Studio report. You can see the dimensions and metrics we use for this report in this spreadsheet. In other words, just create a Google Sheets document exactly like the one I just shared, connect it to your report, refresh the data, and you should be good to go.
I’ll be recording a video walkthrough over the next week or so and post it up here.
Hope this helped!
Thanks
Ah, sorry, I missed your reply! So at least now: thanks a lot for your help! I’ll dig in it.
Btw, is the video walkthrough you mentioned available?
Best!
Olá, muito bom o artigo.
Se puder me ajudar com um erro.
Preciso ver no Data Studio a imagem dos meus anúncios do Facebook, porém não acho uma métrica no Adveronix que faça isso. No Supermetrics usamos a métrica Ad creative image URL. Sabe me dizer se é possível no Adveronix?
Olá Matheus,
Infelizmente, o Adveronix não tem esta feature disponível – só mesmo no SuperMetrics.
Thank you so much!
Hi,
first of all thank you for this tool! All metrics are correct in my spradsheet except for the purchases, do you know what this could be?
Thank you,
Simon
Hey Simon,
You’re welcome! It’s hard to tell without looking at the spreadsheet, but it could potentially be a date formatting issue (happens very often).
If you create a pivot table in your spreadsheet and look at the daily breakdown of sales, do the numbers match?
Thanks,
Hi! First of all, very good post!
I’m having some troubles with data that I import from Facebook with Adveronix. It gets me all the costs, clicks, impressions right, but when it comes to the ‘sales’ metrics (add to cart, initiate checkout, purchases, purchase value) the numbers that adveronix pull from Facebook Ads are different than the ones I have on Ads Manager.
Have you heard anything about this or know a way to fix?
Thank you so much and keep up with the amazing work.
Hi,
That’s odd – is the data wrong on the spreadsheet? Or is the data reported incorrectly on Google Data Studio?
Thanks,